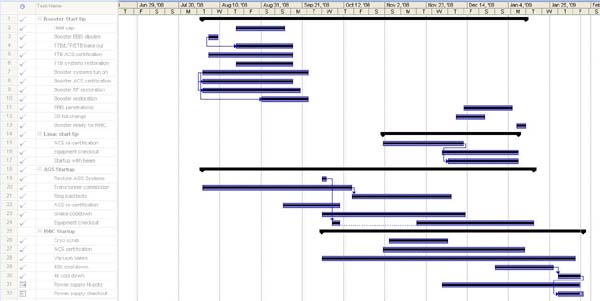
A Gantt chart is a tool illustrated as horizontal bar graphs that stretch from left to right and show a project schedule. Usually each activity, milestone, or task is represented as a bar and shows the start and end dates. A bar can also represent a summary of tasks. It is one of the most commonly used tools by project managers to show an overall project plan.
Here is an example of a Gantt Chart.

Back to Project Management Terms and Glossary
Related Posts
— End
